Your coding agent, drawing on a live canvas

lumen lets an agent describe rich UI in a few lines of OpenUI Lang — and renders it live in your browser. Dashboards instead of walls of text, forms instead of twenty questions. An MCP server and a CLI, all on localhost, no API keys.

agent ──(render_ui / lumen render)──▶ lumen server ──WebSocket──▶ your browser
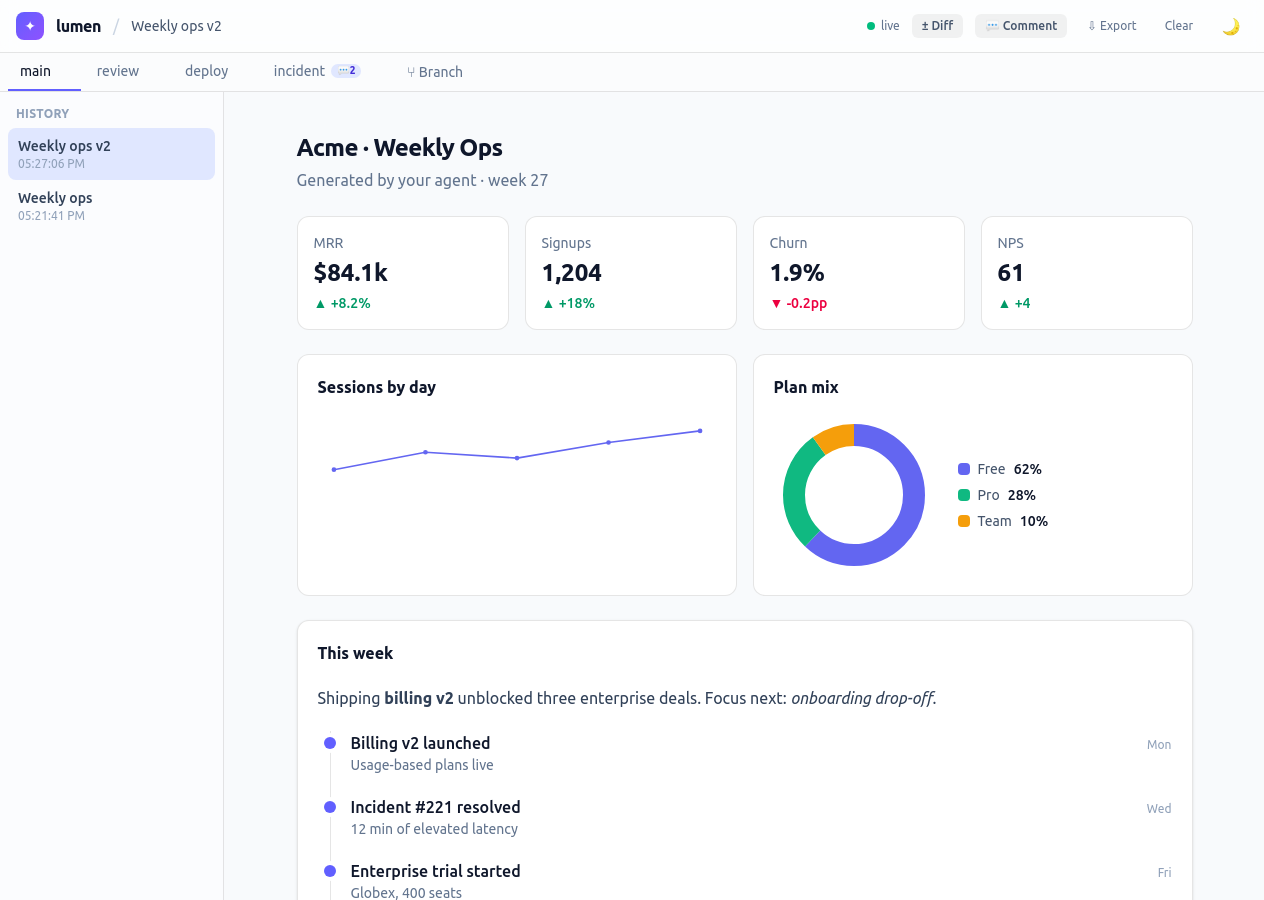
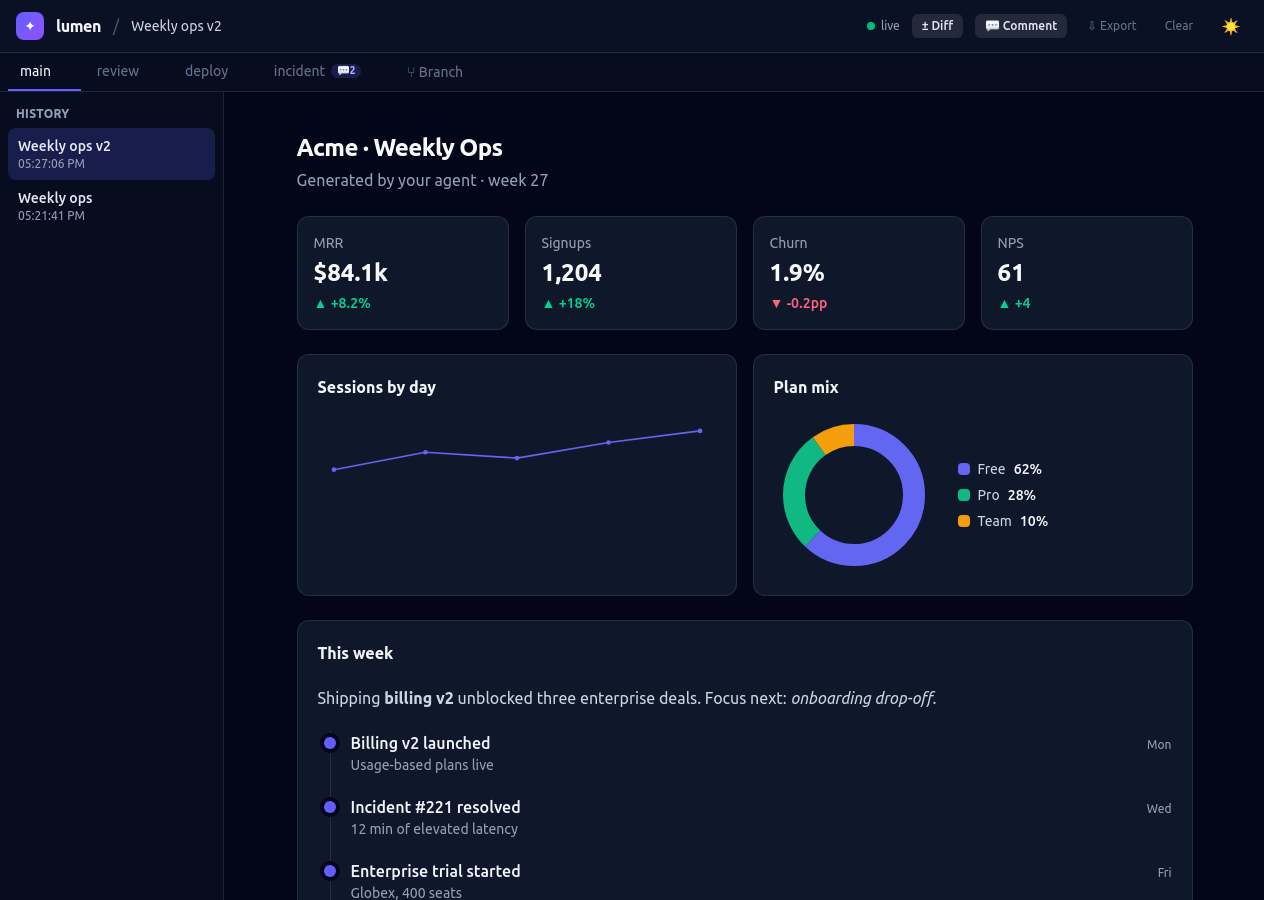
The lumen canvas rendering a weekly ops dashboard with stat cards, a line chart and a donut chart The lumen canvas in dark mode rendering a weekly ops dashboard

Why a canvas?

Some things an agent wants to say are not prose. lumen gives it a second channel.

🖼 50 typed components

Stats, tables, charts, diffs, timelines, forms — Zod-typed, Tailwind-styled, validated server-side so the agent can self-correct.

⚡ Live over WebSocket

Every render hot-swaps the view. Named canvases become tabs; every canvas keeps its own history rail you can scroll back through.

📋 Feedback by clipboard

Comment on any part of the view, answer forms, then one button turns the whole batch into a prompt you paste into your agent. Works with any agent.

± GitHub-style diffs

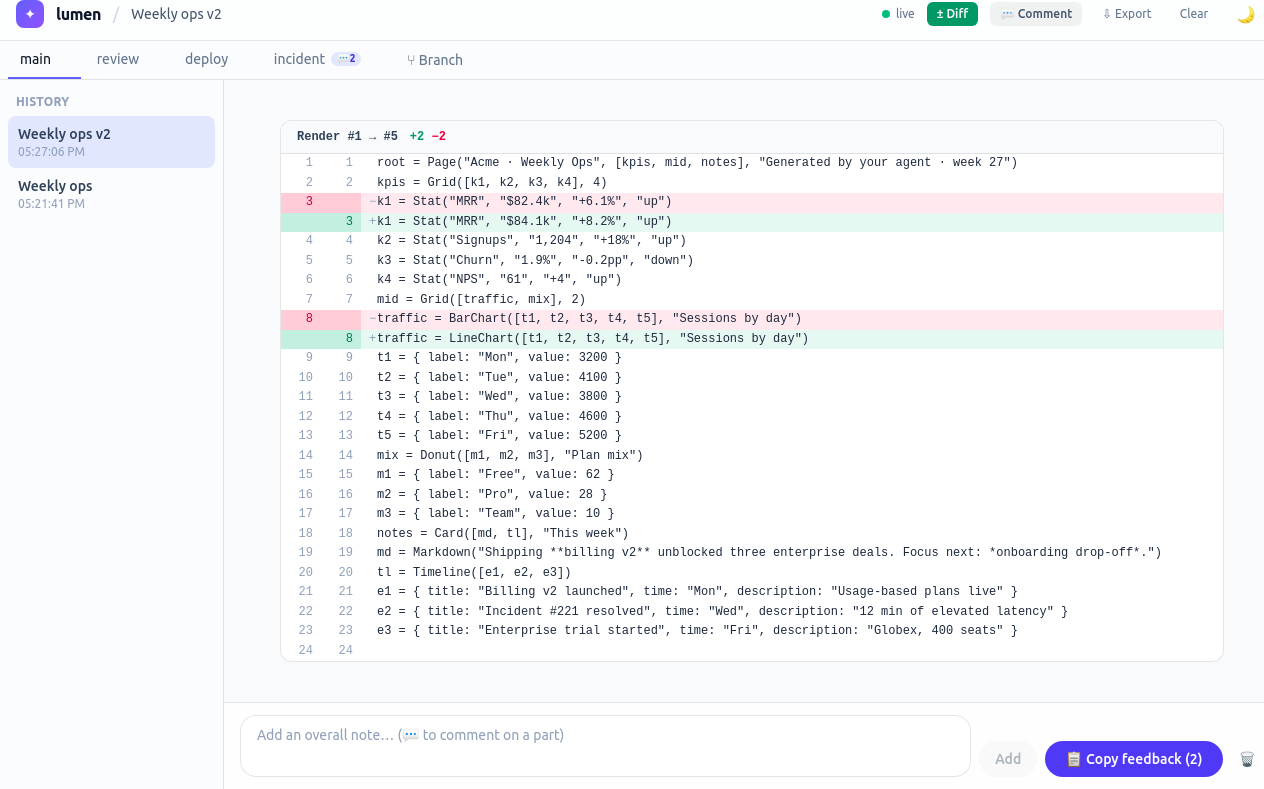
When the agent renders again, toggle a unified diff of the program against its predecessor — see exactly what your feedback changed.

🔒 Localhost, defended

Origin-checked requests, pinned Host, no CORS surface. No network calls, no API keys — the agent is the model.

📦 Export & persist

Canvases survive restarts. Export any view as a self-contained HTML file — or as the OpenUI source that produced it.

Four things it's actually good at

All four views below were rendered by an agent through the real pipeline — each one is a handful of lines of OpenUI Lang.

Reporting

Status dashboards

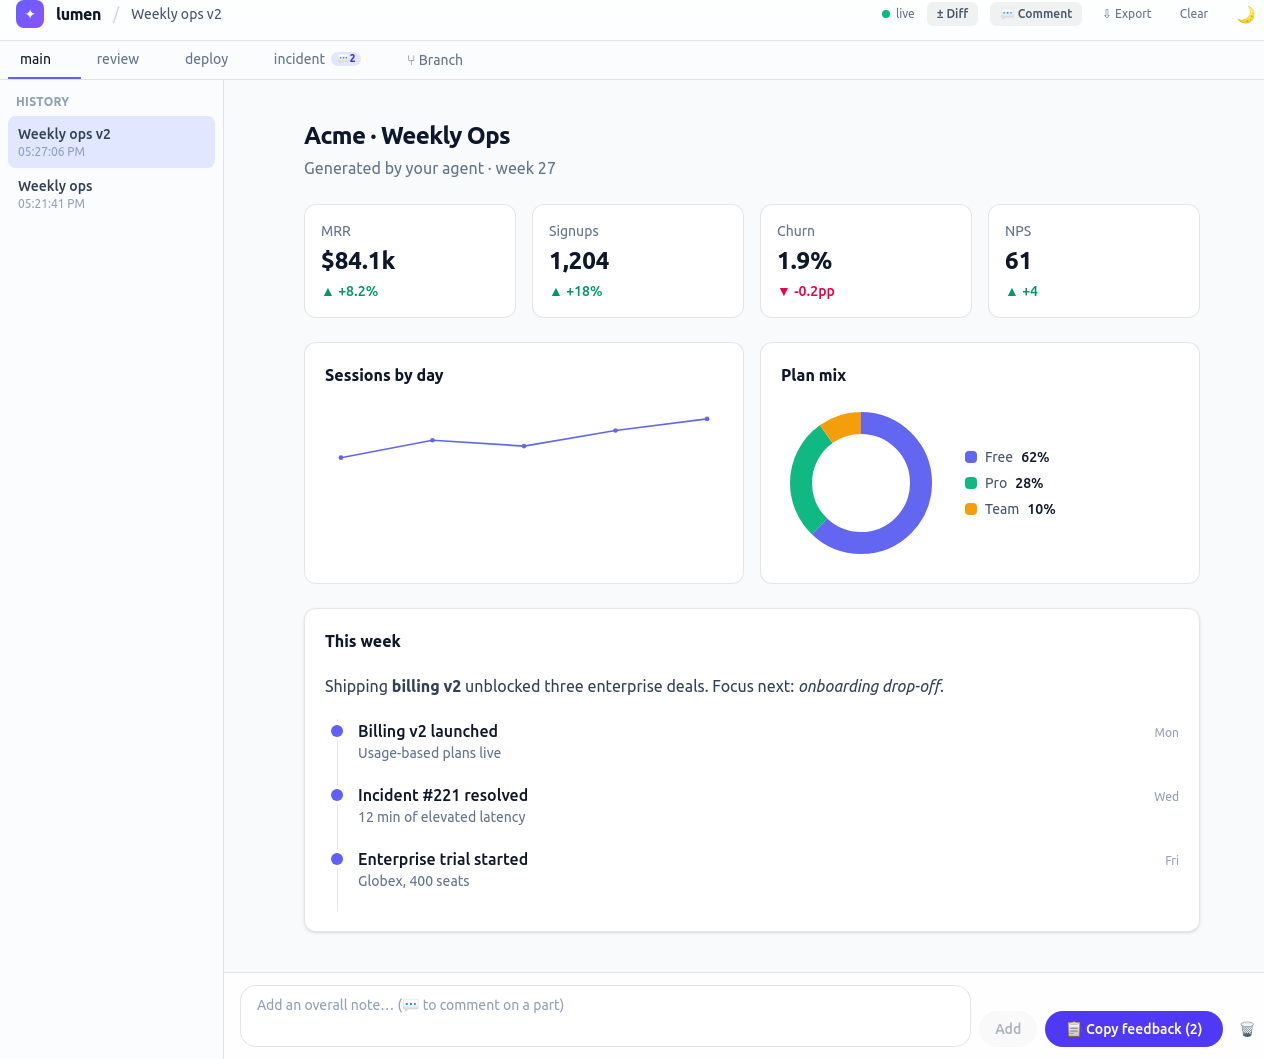
Ask for "this week in numbers" and get stat cards, charts and a timeline instead of a bulleted list. Sortable, paged tables handle the long stuff.

root = Page("Acme · Weekly Ops", [kpis, mid, notes])
kpis = Grid([k1, k2, k3, k4], 4)
k1 = Stat("MRR", "$82.4k", "+6.1%", "up")
traffic = BarChart([t1, t2, t3, t4, t5], "Sessions by day")
mix = Donut([m1, m2, m3], "Plan mix")
Weekly ops dashboard with four KPI stat cards, a sessions line chart, a plan-mix donut and a timeline
Code review

Change walkthroughs

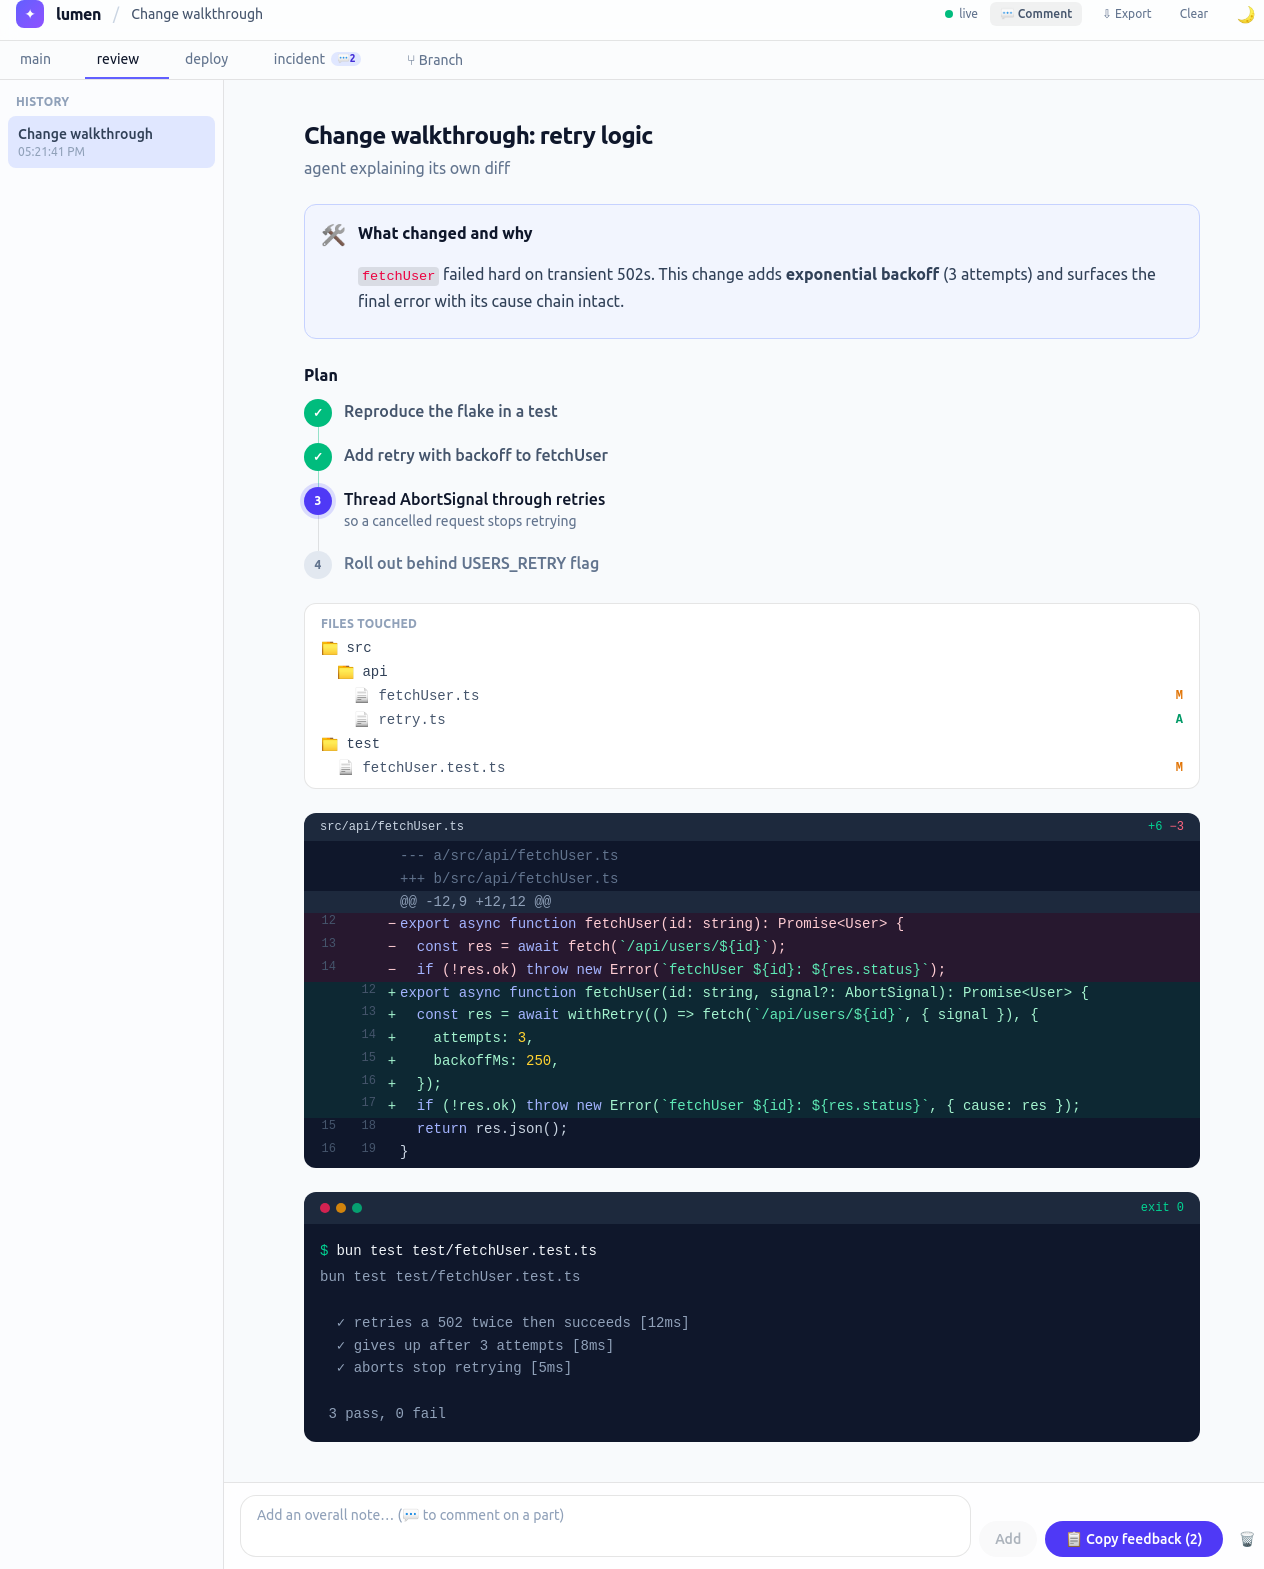
An agent explaining its own diff: the plan with per-step state, the files it touched, the patch itself with syntax-coloured +/− rows, and the test run that proves it.

plan = Steps([p1, p2, p3, p4], "Plan")
files = FileTree([f1, f2, f3], "Files touched")
patch = Diff("--- a/src/api/fetchUser.ts\n...", "src/api/fetchUser.ts", "typescript")
tests = Terminal("bun test ...", "bun test", 0)
A change walkthrough with a step plan, file tree, unified diff and passing test output
Decisions

Approvals that come back as data

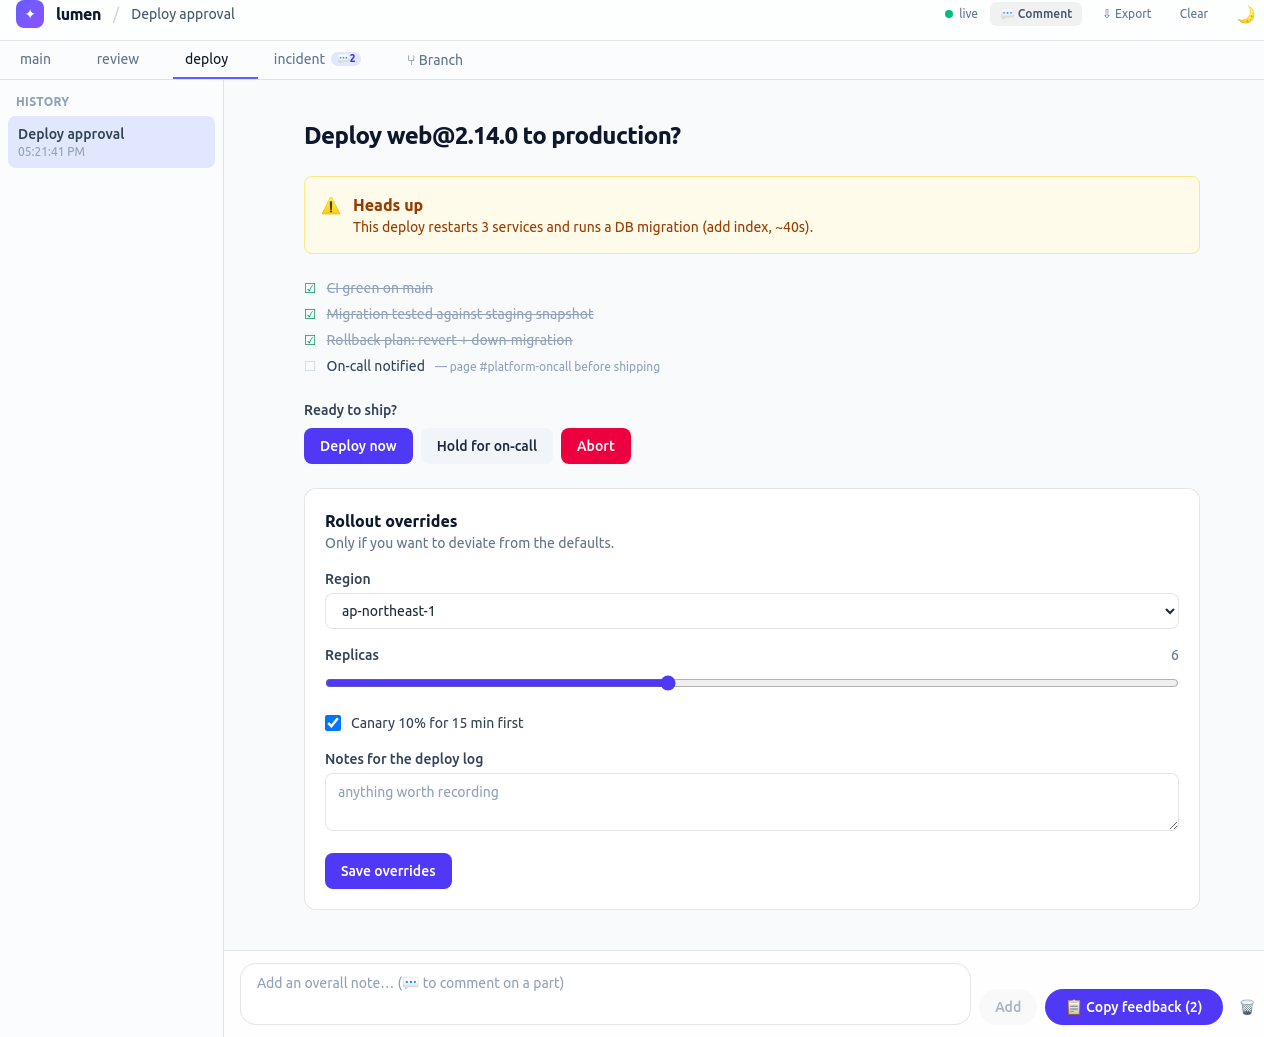
Instead of asking in prose, the agent renders the question: a Choice for the decision, a Form for the overrides. Your answers reach it as exact structured JSON — {"decision":"deploy","region":"eu-west-1","replicas":6} — not parsed prose.

pick = Choice([yes, hold, abort], "Ready to ship?", "decision")
cfg = Form([region, replicas, canary, notes], "Save overrides")
region = Select("region", ["us-east-1", "eu-west-1"], "Region")
replicas = Slider("replicas", "Replicas", 2, 12, 1, 6)
A deploy approval view with a warning, a pre-flight checklist, decision buttons and a rollout overrides form
Operations

Incident timelines

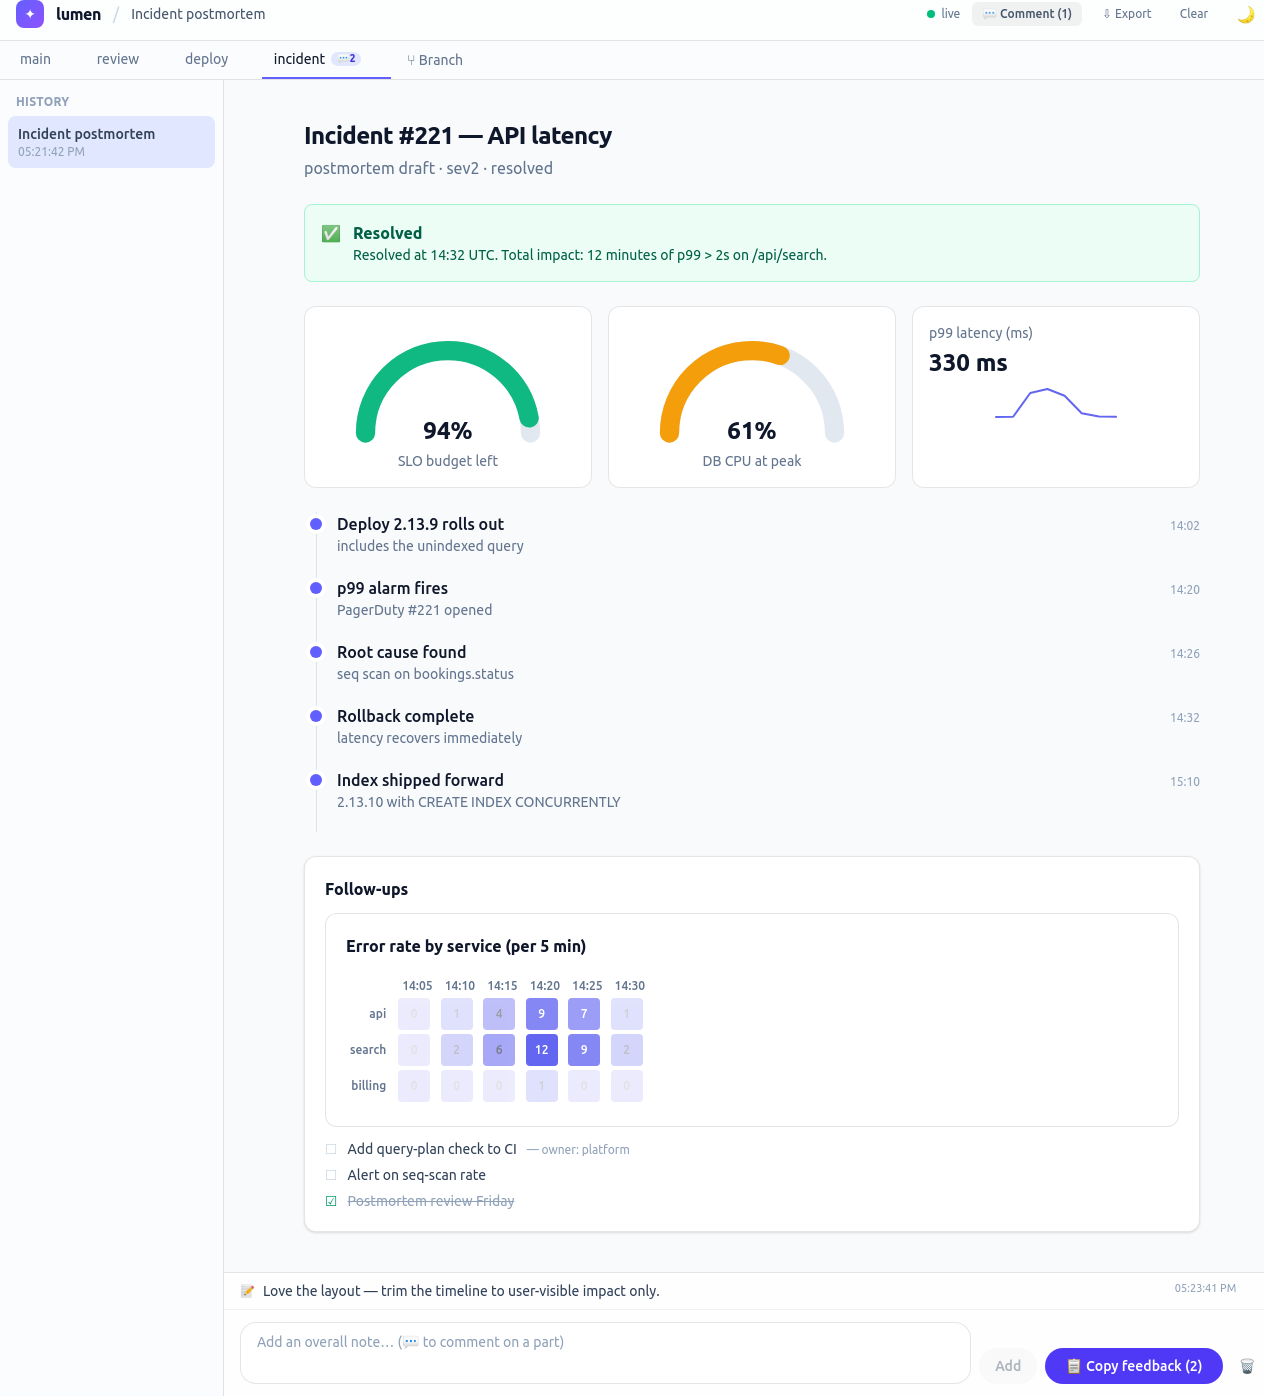
Postmortems read better as gauges, sparklines, a timeline and an error-rate heatmap than as paragraphs. The follow-up checklist keeps its state across re-renders.

g1 = Gauge(94, "SLO budget left", 100, "#10b981")
spark = Sparkline([320, 340, 2100, ...], "p99 latency (ms)")
tl = Timeline([t1, t2, t3, t4, t5])
hm = Heatmap([h1, h2, h3], cols, "Error rate by service")
An incident postmortem with SLO gauges, a latency sparkline, an event timeline and an error-rate heatmap

The feedback loop

lumen never speaks into your agent's session. Your review travels through you — like a code review, for UI.

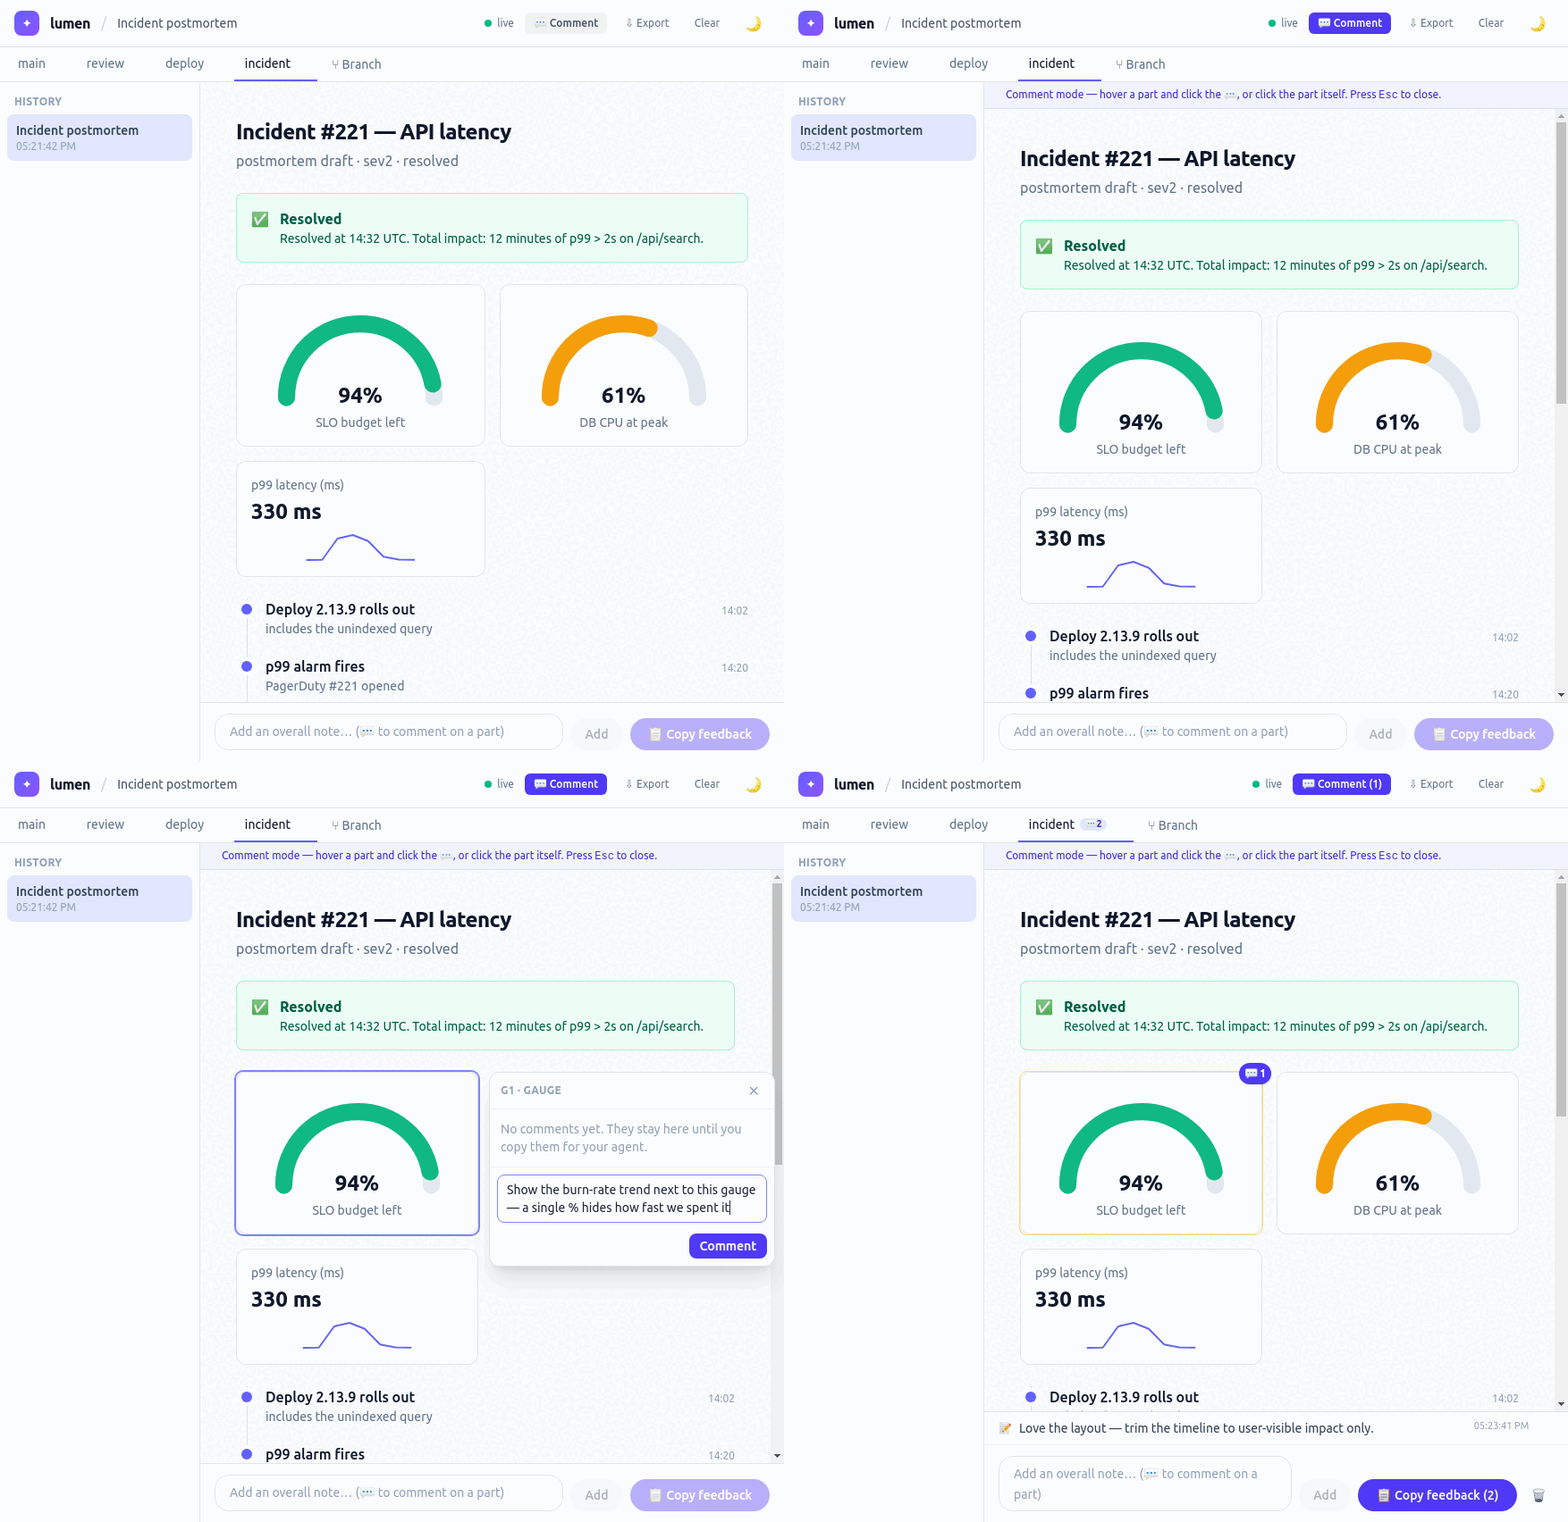
  1. Comment on a part. Toggle comment mode and click any block — an inline popover anchors to it, Notion-style, and records the part's statement id.
  2. Answer forms and choices. Submitted values are recorded into the same batch as exact structured data.
  3. Copy feedback. One button turns the batch into a prompt. Paste it into any agent — it knows exactly which statement every remark targets.
  4. See what changed. When the agent re-renders, the ± Diff toggle shows a GitHub-style unified diff against the previous render.
Animated flow: enabling comment mode, writing an anchored comment on a gauge, adding an overall note, and the copy-feedback button counting the batch

What lands on your clipboard:

Feedback on your lumen view (canvas "incident"). Parts are named by their
statement id in the OpenUI Lang program you rendered; `data:` lines are
Form/Choice answers. Address each point, then update the view with render_ui.

Part `g1` (render #4):
  g1 = Gauge(94, "SLO budget left", 100, "#10b981")
  > Show the burn-rate trend next to this gauge

Part `pick` (canvas "deploy", render #3):
  pick = Choice([yes, hold, abort], "Ready to ship?", "decision")
  data: {"decision":"deploy"}

And when the agent renders again:

Diff mode showing a GitHub-style unified diff between two renders, with changed statements highlighted

The component library

50 components, one authoritative catalog — lumen prompt (or the get_ui_guide tool) prints it, generated from the same definitions the browser renders, so the two never drift.

LayoutPage Stack Row Grid Section Card Divider
TextHeading Text Markdown Code Badge
DataStat Table KeyValue List Timeline Progress
FeedbackAlert Callout
InteractiveButton Link Tabs Accordion
ChartsBarChart LineChart AreaChart Donut Sparkline Gauge Heatmap
MediaImage Avatar Audio
Code & changeDiff FileTree Terminal Steps Checklist
StatusSpinner Skeleton Empty
InputForm TextInput Textarea Select Checkbox RadioGroup Slider Choice

Quick start

Requires Bun ≥ 1.1. Nothing else.

# get it
bun add -g @shinyaigeek/lumen

# wire it into Claude Code — it will spawn lumen for you
lumen setup                         # --user for every project

# or drive it by hand
lumen serve
echo 'root = Page("Hello", [s])
s = Stat("Revenue", "$1.2M", "+12%", "up")' | lumen render -

Or from a clone: git clone https://github.com/Shinyaigeek/lumen.git && cd lumen && bun install && bun run build, then bun src/cli/lumen.ts wherever the commands above say lumen.

Security

A localhost bind is not a trust boundary — any page you have open can talk to http://localhost:4123. So lumen treats the origin as the boundary: every request and WebSocket upgrade is origin-checked, Host is pinned to loopback (DNS-rebinding safe), and POSTs must be JSON so nothing rides the CORS simple-request lane. Rendered output is data, not code — a fixed component set, no eval, no raw-HTML sink. Exported HTML is inert by construction. The guard's four end-to-end attacks are pinned in test/guard.test.ts; report vulnerabilities via SECURITY.md.